The IQ scale is a standardized scoring system with an average of 100 and a standard deviation of 15. It divides scores into seven IQ ranges — also called IQ levels — running from Extremely Low (below 70) to Very Superior (130 and above). It is not a ruler that measures a fixed quantity of intelligence; it is a ranking system that tells you where a person's test performance sits relative to everyone else's. This guide is also a complete IQ score chart: every IQ range with its classification rating, the share of the population in it and the matching percentile, plus the bell-curve IQ distribution behind them, how IQ scoring works, how the scale came to be, and what different tests actually measure.
Quick answer: the IQ ranges at a glance
Most IQ tests use a mean of 100 and standard deviation of 15. The seven IQ levels are below 70, 70–79, 80–89, 90–109, 110–119, 120–129 and 130 and above. In plain terms: 90–109 is average, 120 is about the 91st percentile, 130 is about the 98th percentile, and 140 is about the 99.6th percentile. Read ranges and percentiles together, because small point gaps are often within normal measurement error. Looking up one specific score? The IQ percentile calculator and complete chart lists every whole score from 55 to 160 with its percentile, rarity and classification; for the compact range-by-range version, use the chart further down this page.
The complete IQ score chart: all seven IQ ranges and levels
Most modern tests use classification bands modeled on the Wechsler scales, the most widely administered IQ tests in the world. This is the IQ classification chart those bands produce — first as a picture, then range by range. The bands do not shift with age, because IQ tests are age-normed and every age group is scored against its own cohort; for how the underlying abilities change across a lifetime, see average IQ by age.
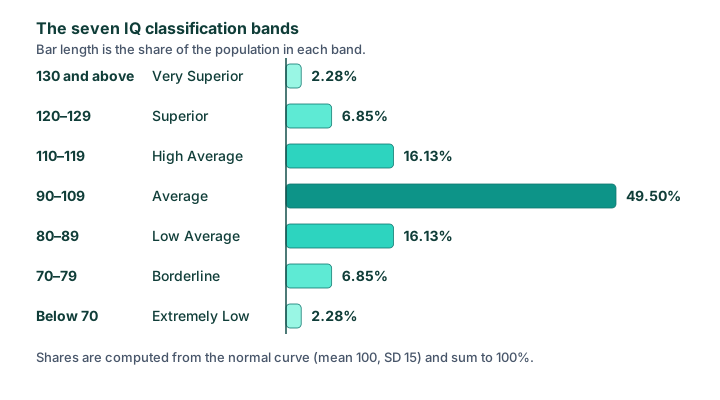
| IQ range | Classification | Share of population |
|---|---|---|
| 130 and above | Very Superior | 2.28% |
| 120–129 | Superior | 6.85% |
| 110–119 | High Average | 16.13% |
| 90–109 | Average | 49.50% |
| 80–89 | Low Average | 16.13% |
| 70–79 | Borderline | 6.85% |
| Below 70 | Extremely Low | 2.28% |
These shares are computed from the normal curve itself (mean 100, SD 15), so they cover the whole population and sum to 100% apart from rounding in the last digit. Published classification tables often quote slightly different figures — 2.1%, 6.4%, 15.7% and so on — because those come from the counted results of one particular standardization sample rather than from the theoretical curve, and they do not sum to 100%. The difference is a few tenths of a percentage point and changes no interpretation.
The labels are conventions, not diagnoses — a score in the Borderline band does not by itself diagnose anything, and a Very Superior score does not certify genius. Newer editions of the Wechsler tests have softened some labels ("Extremely High" instead of "Very Superior"), but the score bands remain the same. Why those labels drift between published charts is covered below; for what counts as a strong score in practice, see what is a good IQ.
IQ levels vs IQ ranges: two names for the same bands
"IQ levels" and "IQ ranges" describe the same seven bands in the table above; the terms are used interchangeably, and neither is the more technical one. A test publisher would call them classification categories, and the number attached to each is a score range rather than a rung on a ladder. The distinction worth keeping is a different one: the bands are a reading aid laid over a continuous IQ distribution, not seven separate kinds of mind. Nothing changes about a person between 109 and 110 except which row of a table they are printed in — which is exactly why percentiles are the more informative way to read a score.
What is a low IQ?
There is no single official cutoff, and that is the honest answer to the question: different sources draw the line in different places because they are answering different questions. On the SD-15 scale, 85 is one standard deviation below the mean and is where a score stops being ordinary variation in everyday use; 89 is simply the top of the Low Average band in the classification table above. The one figure with clinical standing is 70 — the American Psychiatric Association describes intellectual disability as performance "approximately two standard deviations or more below the population, which equals an IQ score of about 70 or below", and its own "approximately" is doing real work, because any score carries measurement error of roughly ±5 to ±7 points either way. All of these are conventions rather than thresholds anyone officially set, and none of them is a diagnosis on its own.
Below-average scores are also far more common than the phrase suggests, because the curve is symmetric — every band beneath 100 has an exact mirror above it:
- Below 90: about 25% of people, or one in four — the mirror image of the 110-and-above group.
- Below 85: about 16%, or one in six. One full standard deviation under the mean.
- Below 80: about 9%, or one in eleven.
- Below 70: about 2.3%, or one in 44 — exactly as uncommon as a score of 130 and above.
That last line is the one worth sitting with: a 68 and a 132 are equally unusual, and only one of them gets called a low IQ score. Since every result carries measurement error of roughly ±5 to ±7 points, the gap between a 72 and a 68 is smaller than the gap between two sittings of the same test by the same person. Read the boundary as a band rather than a line — the percentile behind a score is a steadier reading than the label attached to it, and the same reasoning applied upward is covered in what counts as a good IQ. For the opposite end of the scale — and why no lowest score has ever been recorded — see the highest and lowest IQ scores ever.
Borderline IQ vs borderline intellectual functioning
These are two different things that share a word, and their ranges do not match. "Borderline" in the classification table above is a label for the 70–79 band. Borderline intellectual functioning (BIF) is a clinical descriptor covering roughly IQ 70 to 85 — one to two standard deviations below the mean. A score of 82 is Low Average on the chart and inside the BIF range at the same time. The two vocabularies are not interchangeable, and treating them as if they were is the most common error made with this term.
Because the 70–85 span crosses two rows of the table above rather than matching either one, the population share published for it looks unfamiliar next to this page's figures. On the normal curve the slice between one and two standard deviations below the mean holds about 13.6% of people — roughly one in seven — against the 6.85% in the 70–79 Borderline row on its own. The older DSM-IV-TR V-code put the range at 71–84; current usage generally gives 70–85.
BIF is not an intellectual disability, and it is not a disorder in the DSM-5. The manual retains it only as a V-code listed under "Other Conditions That May Be a Focus of Clinical Attention", without describing what it entails — a gap the psychiatrists Wieland and Zitman argued in the BJPsych Bulletin should be closed. Intellectual disability sits lower and is defined differently: the American Psychiatric Association describes it as performance approximately two standard deviations or more below the population — an IQ of about 70 or below — and requires deficits in adaptive functioning that begin during the developmental period, never an IQ number on its own.
Which is the point worth keeping. Every range on this page describes where a score sits in a distribution, and nothing more. Whether a description like borderline intellectual functioning applies to a particular person is a clinical judgement drawn from a full assessment — a professionally administered test together with a structured look at how someone manages everyday life — and it is not something an unproctored online estimate can establish or rule out. Any online score, including one from this site, carries a wider error band than a proctored test does, and is not a clinical finding.
IQ Revealed is not affiliated with, endorsed by or connected to the American Psychiatric Association, Pearson, Riverside Insights, Mensa or any publisher of the classification systems and tests referenced on this page. They are cited so that the labels on this chart can be traced back to where they actually come from.
FAQ-style guide to key IQ score ranges
What is the IQ scale?
The IQ scale is a normed ranking system, not a direct readout of a fixed biological quantity. Your score tells you how your test performance compares to a reference population tested on the same instrument.
Which part of the IQ scale counts as average?
The standard "Average" classification is 90–109, with about half of people in that band. A broader spread is 85–115 (about 68% of the population). For exact conversions by point, use the IQ percentile table, and for what those bands mean for a typical score, see what the average IQ is.
Is a 120 IQ genius?
No. An IQ of 120 is roughly the 91st percentile and is usually described as above average or superior on common SD-15 scales. "Genius" is not a standardized modern diagnostic classification, so the score is better described by percentile and test context. For where the threshold actually sits, see what is a high IQ.
What does IQ 130 mean?
IQ 130 is roughly the 98th percentile (top ~2%) on SD-15 tests and is often used for gifted cutoffs — and it is the neighbourhood of the Mensa qualifying score. It indicates rare performance, but it still should be interpreted with confidence intervals and test context.
Is a 140 IQ considered genius?
An IQ of 140 is around the 99.6th percentile and is exceptionally high, but "genius" is an informal label rather than a standardized diagnosis. Test quality, confidence intervals, and the instrument's ceiling still matter.
Why do score-range differences matter?
A 10-point gap near the mean and a 10-point gap in the far tail do not imply equal rarity differences. The bell curve is dense in the middle and thin at the extremes, which is why range-plus-percentile interpretation is more useful than point chasing.
The IQ distribution: why the scale is a bell curve
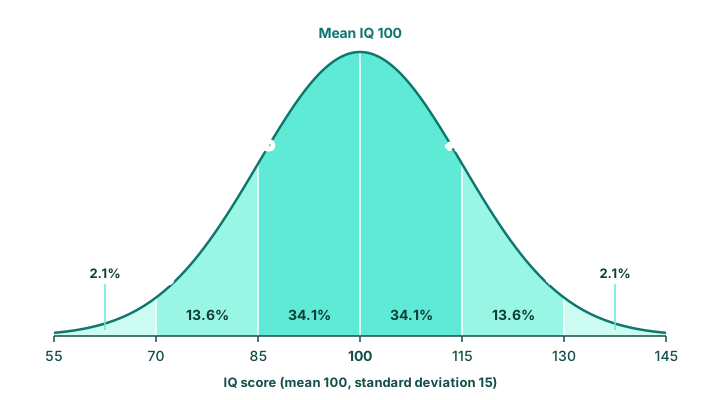
The IQ distribution is a normal distribution — the familiar bell curve. Scores cluster densely around the mean of 100 and thin out symmetrically toward both tails, so the IQ curve is tall in the middle and shallow at the edges. The standard deviation of 15 is the curve's unit of distance, and it produces three numbers worth memorizing:
- About 68% of people score within one standard deviation of the mean — between 85 and 115.
- About 95% score within two standard deviations — between 70 and 130.
- About 99.7% score within three — between 55 and 145.
This is why extreme scores are so rare: only about 1 person in 44 scores 130 or above, and only about 1 in 740 reaches 145. It is also why every IQ score maps cleanly onto a percentile — a rank against the population — which you can look up in our IQ percentile table.
A short history of the IQ scale
Binet: the first practical test
The scale begins in Paris in 1905, when Alfred Binet and Théodore Simon built a test to identify schoolchildren who needed extra help. Their innovation was the concept of mental age: a child who solved problems typical of an average 10-year-old had a mental age of 10, whatever their birth certificate said.
Stanford-Binet and the ratio IQ
Stanford psychologist Lewis Terman adapted the test for the United States in 1916 as the Stanford-Binet. It used German psychologist William Stern's formula for an "intelligence quotient": mental age divided by chronological age, multiplied by 100. A 10-year-old performing like a typical 12-year-old scored 120. The term "IQ" comes from this literal quotient.
Wechsler and the deviation IQ
The ratio formula breaks down for adults — mental age plateaus, so dividing by chronological age becomes meaningless. David Wechsler's solution, introduced with his 1939 test and universal today, was the deviation IQ: compare each person to others of the same age and express the result as a position on a normal curve with mean 100 and SD 15. Modern "IQ" is therefore not a quotient at all — it is a standardized rank. This age-norming is also why average IQ stays 100 at every age even as raw abilities change across life.
One practical footnote: because tests are periodically re-normed and raw performance rose through the 20th century (the Flynn effect), today's 100 reflects a higher raw performance than the 100 of 1950 — see our guide to the average IQ for details. The same guide covers the average IQ in the USA and why country rankings disagree.
How IQ scoring works, and why one chart covers every test
IQ scoring is standardized, which is why a single IQ score chart can be used to read a result from almost any test. Every mainstream test is scored so that the average of the norming population is 100 and one standard deviation is 15 points. Your answers are not added up into points; they place you somewhere in that distribution, and the chart above is simply that distribution written out.
Two practical consequences follow. First, an IQ scoring result is only meaningful next to the group it was normed against — which is why the same chart works for adults and for children, each compared with their own age group. Second, the numbers in the chart are not conventions somebody chose; they are areas under the normal curve. No committee decided that about 2% of people should be "Very Superior" — that is simply the area beyond two standard deviations. For the mechanics of how a raw test performance becomes one of these numbers, see how IQ is calculated.
Why IQ ratings and classification labels differ between charts
The words in the classification column — sometimes called IQ ratings — are the least stable part of any IQ chart. Compare charts from different sources and you will notice the labels shift while the numbers stay put. Older Stanford-Binet charts used terms like "genius" for the top band; current Wechsler manuals prefer neutral phrasing such as "Extremely High" where older editions said "Very Superior." Some charts split the top band at 145, as ours does, others at 140 or 150.
None of this changes what a score means. The underlying percentile is fixed by the bell curve, and the words draped over it are editorial choices made by publishers and revised between editions. When two IQ charts appear to disagree about your score, check the percentile column — it will almost always agree. That is the single most useful habit when reading any chart, and it is why every table on this page carries a percentile beside the label.
What different tests measure
"IQ" is a family of tests, not a single instrument, and they do not all probe the same abilities:
- Wechsler scales (WAIS for adults, WISC for children) combine four index areas — verbal comprehension, perceptual reasoning, working memory and processing speed — into a full-scale score.
- Stanford-Binet (5th edition) measures five factors, including fluid reasoning, knowledge, quantitative reasoning, visual-spatial processing and working memory.
- Raven's Progressive Matrices is entirely nonverbal — abstract pattern completion — making it popular for testing across languages and cultures.
- Cattell Culture Fair similarly minimizes language, but reports scores on an SD-24 scale, so its numbers run higher for the same percentile.
That last point matters when comparing scores: a 148 on the Cattell scale is the same rank as a 130 on a Wechsler test. Percentile, not the raw number, is the common currency.
Despite their different formats, well-constructed tests correlate strongly with one another, which is the empirical basis for the idea of a general ability factor ("g") running through them. But the correlation is not perfect — a person can plausibly land ten points apart on two different instruments taken in the same month. That is normal, expected behavior of the scale, not evidence that one test "lied." It also means the scale has a practical ceiling: above roughly 145–150, too few people exist in any norming sample for standard tests to rank scores reliably, which is why extraordinary claims about record scores rest on shaky ground — a story we unpack in the highest IQ ever recorded.
What each band means in plain English
Labels are shorthand; here is the practical reading of each band, keeping in mind that the borders are soft and individuals vary widely within every range:
- Very Superior (130+): about 1 person in 44. The usual threshold for gifted programs and high-IQ societies; abstract reasoning tasks that most people find hard tend to feel routine.
- Superior (120–129): roughly the 91st to 97th percentile, a range common among people in cognitively demanding professions.
- High Average (110–119): comfortably above the mean — about one in six people. Typically associated with smooth progress through higher education.
- Average (90–109): the broad middle of the curve, holding half the population. Most jobs, degrees and life outcomes are well within reach across this band.
- Low Average (80–89): below the midpoint but within the normal range; about one in six people score here.
- Borderline (70–79): a range where standardized academic work is often harder; clinicians look at adaptive functioning, never the score alone.
- Extremely Low (below 70): about 2.3% of scorers. A score here is one criterion considered in assessments of intellectual disability, always alongside real-world functioning.
Reading your own score on the scale
Three cautions keep the scale in perspective. First, every score carries measurement error — a typical confidence interval is about ±5 to ±7 points, so treat classification borders as fuzzy, not sharp. Second, online tests provide estimates for self-knowledge and practice; they are not clinical instruments, and formal decisions (educational placement, disability assessment) require a professionally administered test. To review common formats before testing, see our sample IQ questions with answers. Third, the composite number summarizes several distinct abilities — two people at 105 can have very different cognitive profiles. The scale tells you where you rank; a good assessment also tells you how you think.